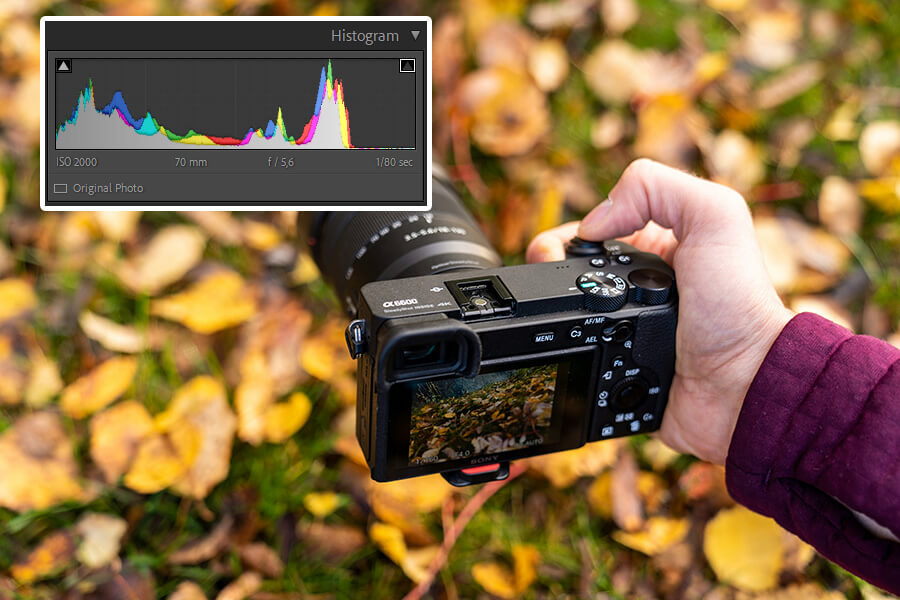
As boring as histograms may seem, here’s the truth.
If you learn how to read a histogram, you can take better pictures.
Is it hard?
Nope, not at all. As a matter of fact, a histogram is a simple reference that instantly tells you if your image is too dark, too bright, or just about perfect.
In this guide, I’m going to explain what a histogram is, where to find it, as well as the best situations to use it. I guarantee you that in 5 minutes you will have a much better understanding of it.
What is a Histogram?
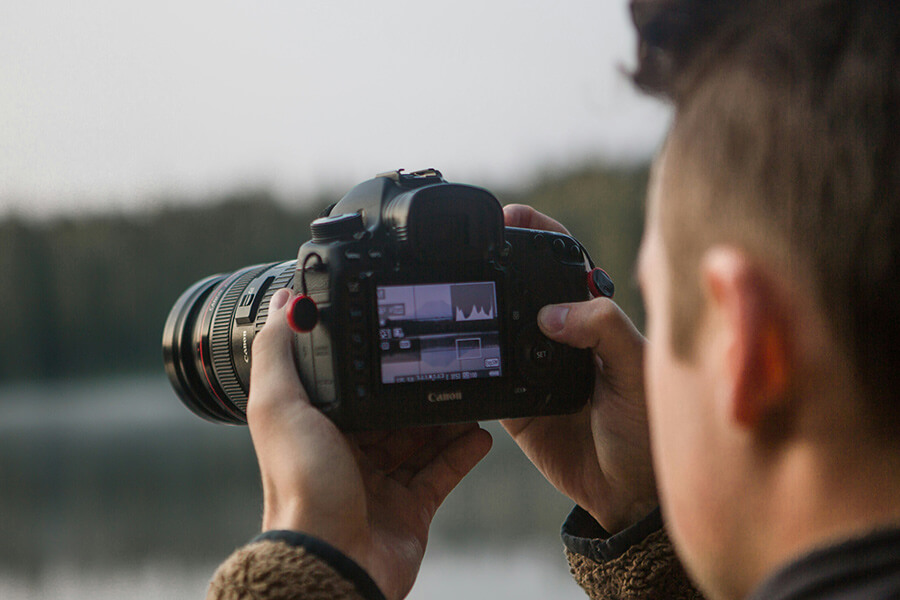
You can’t always trust the LCD screen of your camera.
That’s why we have histograms. It’s a graph that shows the darkest and brightest parts of your photograph.
A histogram is the easiest way to see if your exposure is set correctly. The goal of every photograph is to maximize the amount of details in dark and bright parts, but your eyes can’t always be trusted.
As scary or boring as histograms may seem, they are just another tool we can use to not screw up our images.
Most mirrorless and DSLR cameras allow you to see the histogram before taking the picture. Others can only display it in playback mode after you’ve taken the picture. Both modes are absolutely fine and useful.
If you shoot in RAW format or do a lot of Lightroom/Photoshop editing, it’s almost a requirement for you to understand them.
How to Read a Histogram for Better Photos
Your photograph is made of pixels. Millions of them.
A histogram gives us a visual representation of how many dark and bright pixels there are, as well as everything in between.
In photography, these tones are usually labeled like this (darkest to brightest):
- Black
- Shadows
- Midtones
- Highlights
- White
A histogram will help you at making sure you aren’t losing more details than necessary.
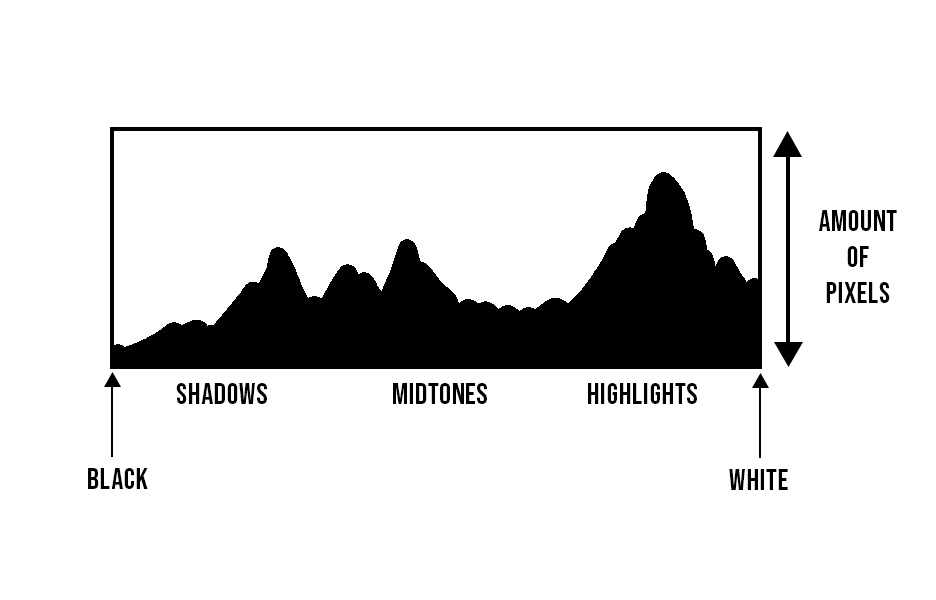
See those peaks and valleys?
If the peaks go above the graph, it means your pixels in that specific area are “ruined”.
If they go over, it means that information is clipped (lost). It applies to black and white corners as well; if it looks like the graph could extend way beyond, your exposure was incorrect.
A little bit is often okay, but try not to have extreme mountains that look like they could continue forever.
Here’s the secret to understanding histograms:
- You rarely want any peaks to go way over the edges (left, right, up)
If the graph goes way over white, it means you have clipped the highlights. Usually this looks like an overblown sky, lack of contrast and an overall bad image. We call this an overexposed image.
Overexposure means your settings allowed too much light into your camera for this particular scene. What’s bright in real life actually appears as totally white. It could be because of your shutter speed, aperture or ISO. Perhaps a combination of all 3.
If the graph goes way over black, it means you have clipped the shadows. What should appear dark on your image looks completely black, unnatural and weird. We call this an underexposed image.
Similarly, it means your settings weren’t letting enough light into the camera. You could simply increase the length of your shutter speed, open up the aperture or increase your ISO level.
Let’s look at a couple of histograms that aren’t too good.
Underexposed Histogram
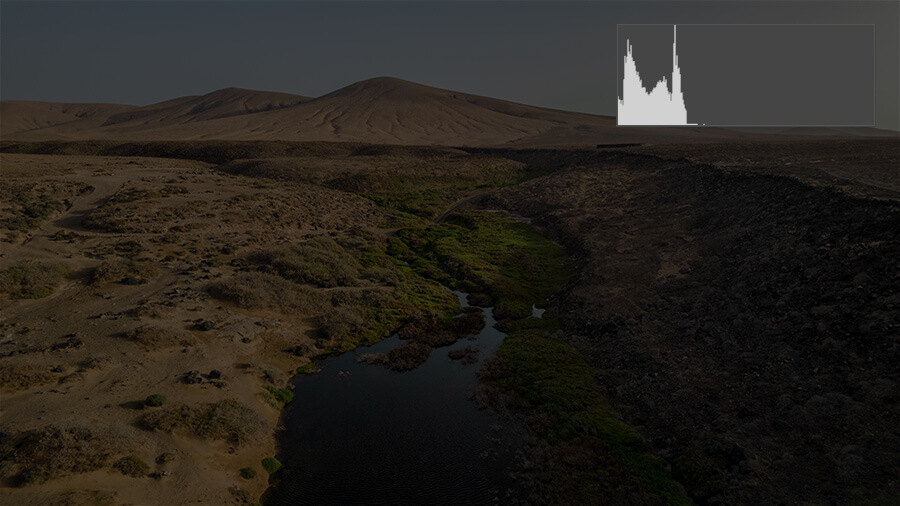
These examples are intentionally bright/dark, so you can spot the differences quicker.
See how abruptly the black edge stops in the histogram above? It doesn’t gradually decline, which tells us we are definitely losing some information in darker areas of the image.
There’s also a lack of any midtones and highlights, but this could be intentional.
Overexposed Histogram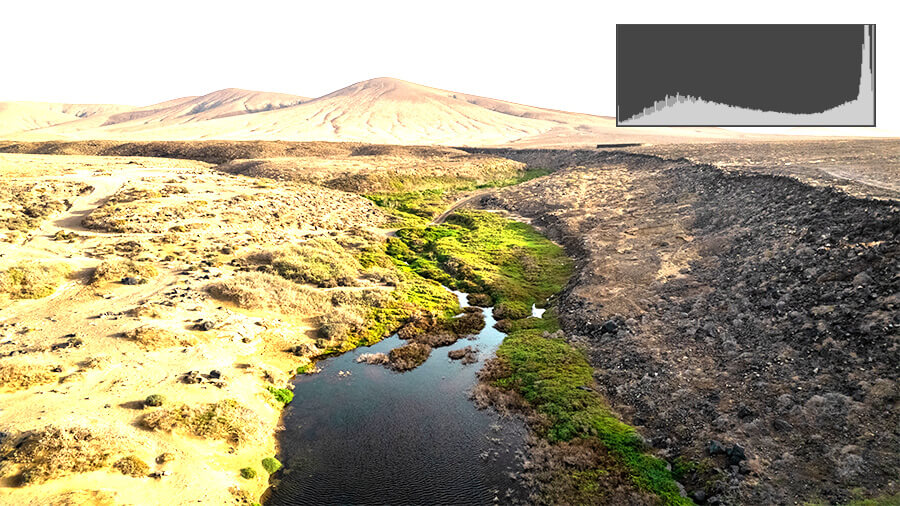
Here’s the opposite problem; overexposure.
First, you can see that shadows and midtones all look perfectly fine. Nothing goes over the left or top part of the histogram.
The problem is in the highlights/white area. If you look at the sky you can see that there’s no detail at all, but when photographing outdoors you might not always be able to spot this without the use of a histogram.
This is an extreme example, but it’s very easy to clip the highlights when photographing landscape or outside on a sunny day.
Some cameras (Sony) actually have a metering mode that’s specifically made so you don’t lose the highlight information.
Properly Exposed Histogram
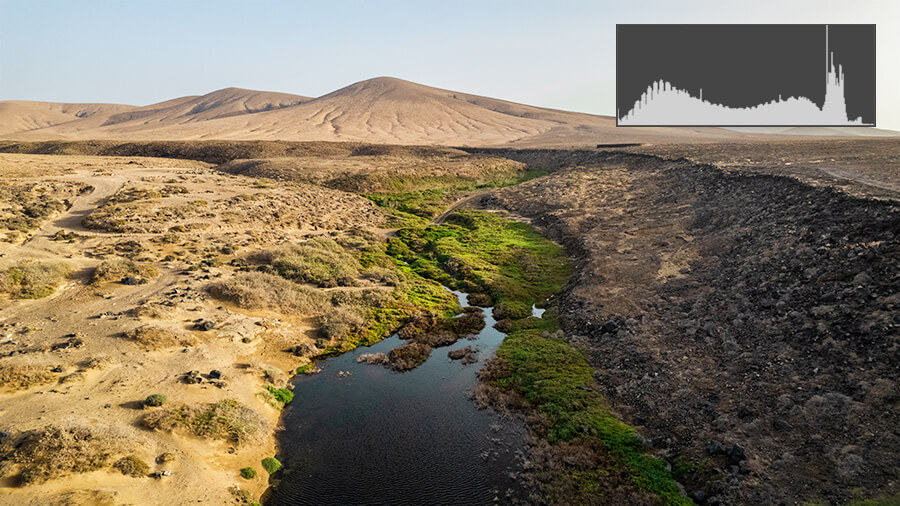
This is an example of a more balanced exposure. We are not losing anything in the shadows, nor highlights.
As a matter of fact, I could actually slightly increase the exposure in post-process. There’s a little bit of empty space in the white area, which means I could try and recover some more information. Shooting in RAW format makes this much easier, whereas in JPEG I would be out of luck.
So why would I even use a histogram for this landscape image above?
Well, there’s a bright sky, plenty of midtones, and a dark area with water and rocks.
If I relied purely on my eyes, it would be easy to clip a certain tone.
By using the histogram, it’s easier to find just the right exposure that will get in as many details as possible. I don’t want to clip my shadows or highlights; that’s lost information we can never bring back in post-process.
When & How To Use a Histogram?
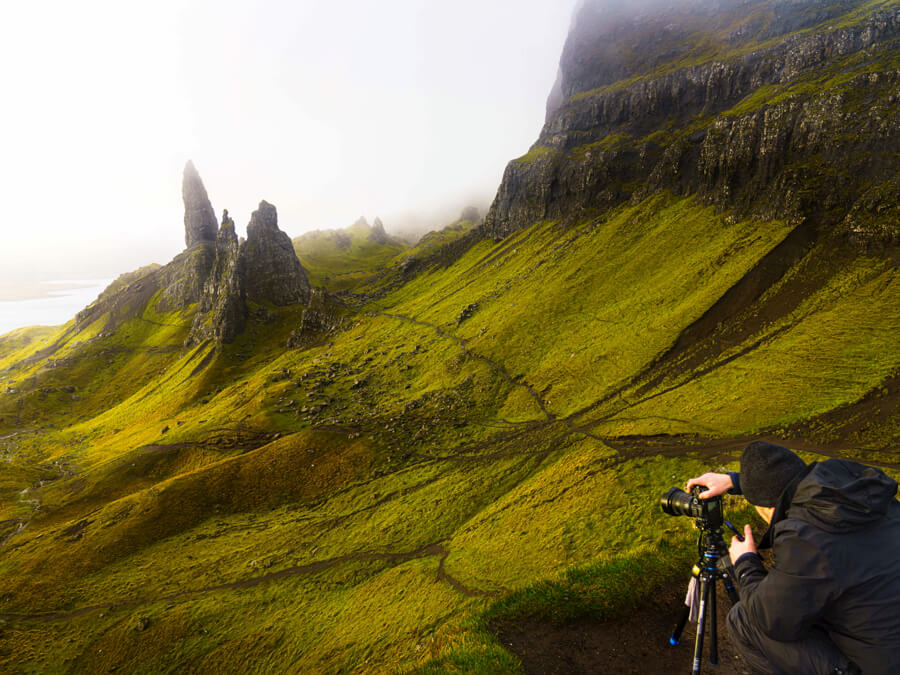
First of all, there is no perfect histogram.
Your camera doesn’t know what you want. The histogram only displays the luminance of the pixels it detected.
It may go well over the edges, but if it visually looks like you want it to, it’s not a problem.
If you are photographing at night, it’s impossible to have lots of details in brighter areas. Judging by the histogram, you’d think you needed to raise your exposure. That’s simply not true.
When to use a histogram?
- When you have a bright background (usually sky, wall, studio)
- When it’s so bright you can’t trust your LCD monitor
- When there’s lots of dark and bright parts, but you need as much detail as possible
Use a histogram when the shot is important and you have enough time.
- Landscape
- Portraits
- Products
- Studio
- Weddings
When shooting landscape, you’re not really in a rush. Those few extra seconds of looking at a histogram won’t ruin the moment.
Use histograms when you get to a new location and plan on spending a lot of time there. For example, weddings are fast-paced, but if you’re going to be inside the same space for a few hours, it helps to at least once see what your histogram is telling you.
It’s completely different when traveling, or doing casual photography. I almost never look at my histograms in those situations. I trust my eyes and my camera enough, and it’s not like we can’t live without the histogram.
Is There a Perfect Histogram?
No.
Don’t worry about capturing peaks and valleys in the entire histogram, it’s not always possible.
If you’re taking pictures of a black subject in front of a white wall, you simply can’t get too many midtones.
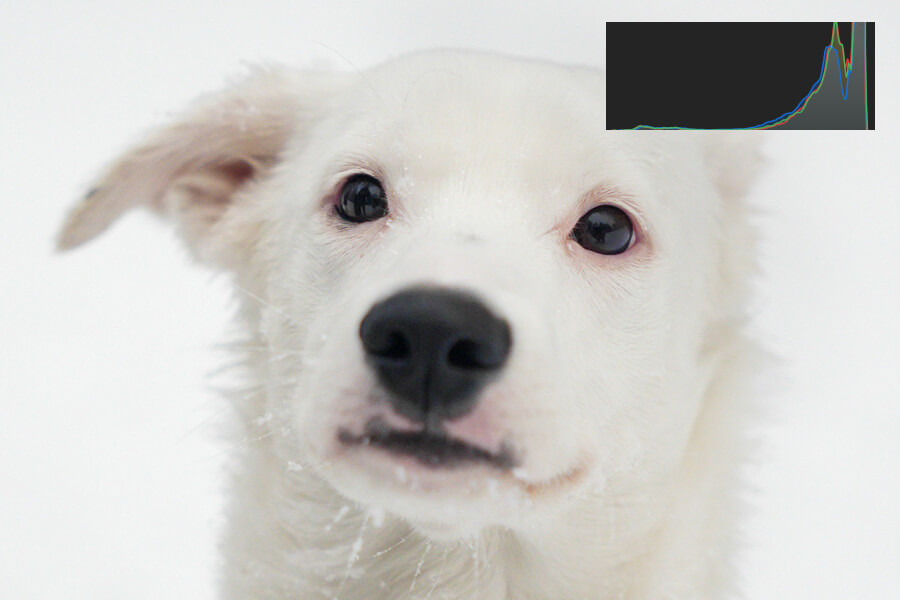
When photographing a white dog in snow, it’s impossible to get a ton of black/shadow information. At least not with a proper exposure that looks natural.
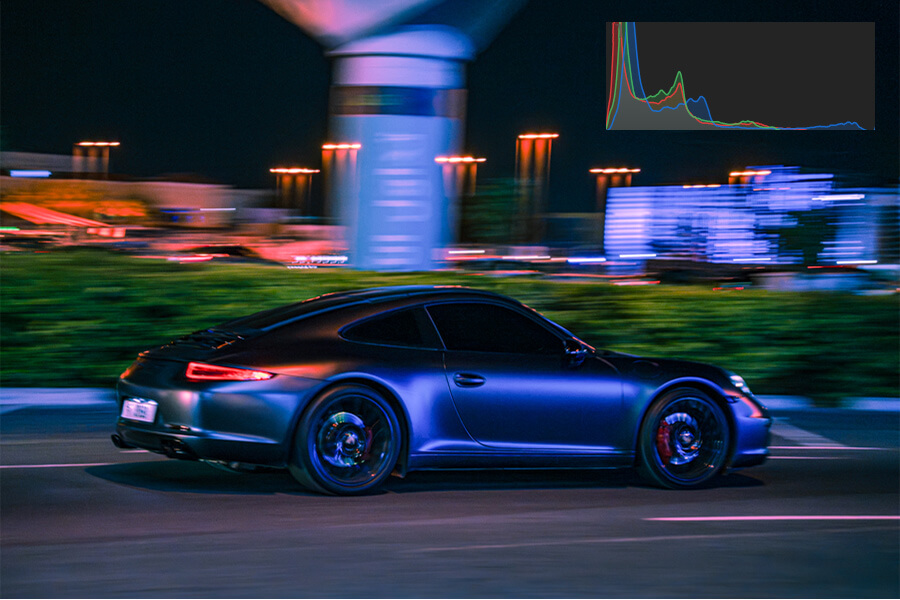
Same goes for this night time photograph of a car. You’re not going to see a balanced histogram that has peaks and valleys in the entire tonal range.
In some situations, your histogram has to look bad.
This is most common in landscape photography.
How to capture the white sky + dark environment? It’s impossible to do it in a single photo.
Therefore, I usually expose for the darker area and “ignore” the sky. A little bit of lost details in a bright sky is okay. Especially if it doesn’t bring much value and excitement to the photograph anyways.
Histograms in Lightroom/Photoshop
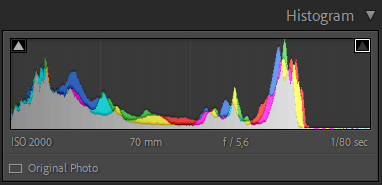
Most editing programs can show a histogram of your photo.
Just like with your camera’s LCD screen, this is a great way to have a reference for your exposure. Did you raise the shadows too much, or is your overall exposure too dark?
RBG Histogram
There’s also an RGB histogram that displays the levels of red, blue and green in an image.
If one of your colors is clipping, you can simply use the curves feature to reduce its amount. Curves allow you to target the shadows, midtones or highlights, so you can be super precise when editing colors.
Where to Find the Histogram on Your Camera?
- Canon: Press “Info” button repeatedly when reviewing your images
- Sony: Press “Display” button repeatedly when shooting/reviewing images
- Nikon: Press “Info” button repeatedly when shooting/reviewing images
- Fujifilm: Press “Disp Back” button repeatedly
If you can’t see the histogram in your camera, you might have to dig through the menus. Not every camera model has it enabled by default, but they all definitely have the option.
Most cameras have histogram for luminance, as well as RGB levels.


